
Since the Fair Housing Act’s passage in 1968, the US Department of Housing and Urban Development (HUD) has monitored how state and local governments promote fair housing through the Affirmatively Furthering Fair Housing (AFFH) process.
A new Fair Housing Data Mapping Tool released by the Urban Institute and the National Fair Housing Alliance aims to expand access to fair housing data for policymakers and local stakeholders. The tool incorporates many of the core indicators previously available through the AFFH data system while adding a new homeownership measure. Because homeownership is critical for housing stability and intergenerational wealth building, this addition provides important context for understanding housing disparities.
The updated platform enables local stakeholders and policymakers to examine home purchase patterns and differences across communities and assess how these trends intersect with other fair housing indicators.
Why homeownership matters for fair housing
Homeownership is the primary asset-building channel for most US households. Urban’s research found those who buy homes earlier in life have substantially greater wealth in their retirement ages. Housing equity (PDF) can be used to finance educational attainment, support business formation and other investments, and help households manage health care costs. It also facilitates intergenerational wealth transfers, such as assisting children with down payments on their first homes.
The structure of the US mortgage market reinforces these benefits. Because many borrowers rely on long-term fixed-rate mortgages, homeowners often experience greater payment stability than renters, facing market-driven rent fluctuations. This stability can enable sustained saving and investment over time. As a result, the wealth gap between homeowners and renters has widened steadily and reached historic highs in 2022. Research by the National Fair Housing Alliance released in 2025 (PDF) shows the persistent racial homeownership gap in the US. The White homeownership rate in late 2024 was 74.4 percent, while the Asian American, Native Hawaiian, and Pacific Islander homeownership rate was 62.7 percent; the Latino homeownership rate was 48.8 percent; and the Black homeownership rate was 46.4 percent. Beyond financial gains, homeownership is associated with residence in higher-opportunity neighborhoods and with greater residential stability, both of which are linked to improved educational attainment, labor market outcomes, and broader well-being.
Despite these advantages, access to homeownership hasn’t been equitable. Some communities historically have faced greater systemic and institutional barriers (PDF) to homeownership, and more recently, rising unaffordability has led many young first-time homebuyers to delay buying homes. In the Fair Housing Data Mapping Tool, we’ve included two new variables that can further illustrate homebuying trends across different groups and regions: mortgage application rates and mortgage denial rates.
What the new tool shows
Recognizing the importance of homeownership for advancing fair housing goals, the updated Fair Housing Data Mapping Tool incorporates mortgage application rates and mortgage denial rates to shed light on access to mortgage credit. These measures allow users to examine how entry into homeownership varies across time, geography, and racial and ethnic groups. By capturing both the demand for mortgage credit and the barriers to approval, the indicators provide a more comprehensive view of the homebuying process and the obstacles households may face.
State-level example: To demonstrate the tool’s application, we first selected the years 2019 and 2023, all states, and all households. This allows users to visualize state-level mortgage application and denial rates over time and download the data.
Changes in Application Rate (Percentage Points) Between 2019 and 2021
Sources: 2019 and 2023 Home Mortgage Disclosure Act American Community Survey data.
Notes: Home Purchase Mortgage applications for owner-occupied homes only.
Changes in Mortgage Denial Rates (Percentage Points) Between 2019 and 2023
Sources: 2019 and 2023 Home Mortgage Disclosure Act American Community Survey data.
Notes: Home Purchase Mortgage applications for owner-occupied homes only. Applications withdrawn by borrowers and files closed for incompleteness are taken out of the calculation
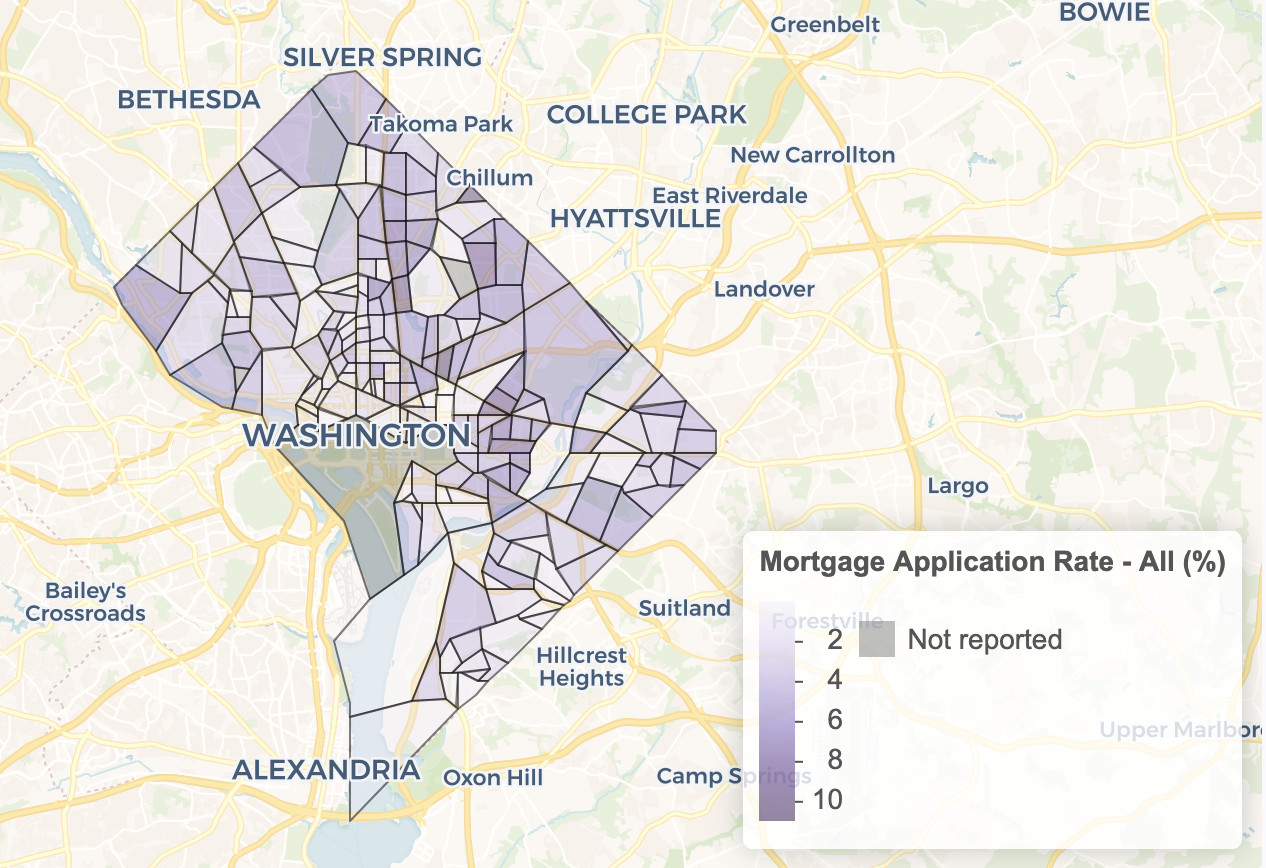
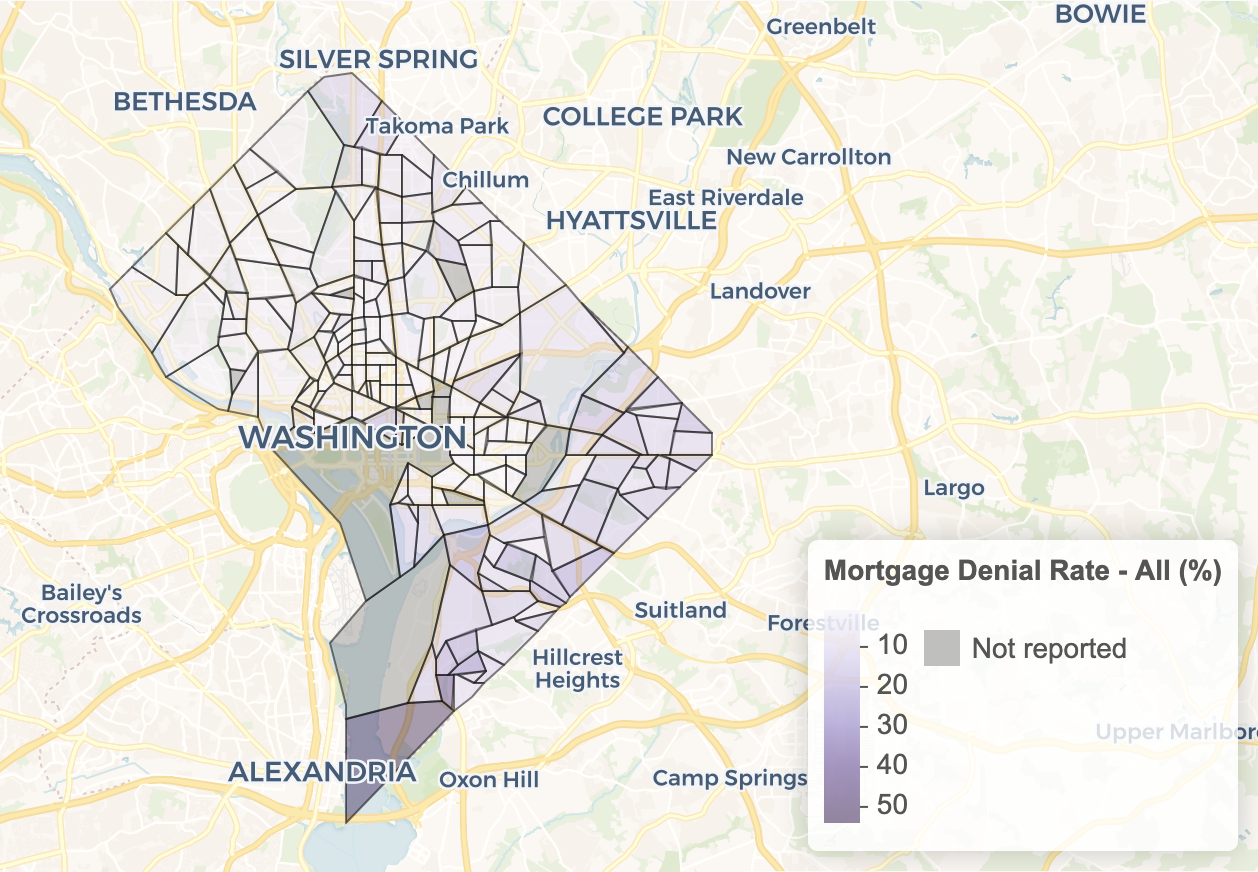
Neighborhood-level example: Users can also zoom in to the county or census tract level. Here, we’ve visualized the census tract–level mortgage application and denial rate for Washington, DC, as an example. Because of the sample size, we aggregated Home Mortgage Disclosure Act data from 2020 to 2024. To ensure accuracy, we do not report values when the sample size is fewer than 30 observations. The map reveals substantial variation in both application and denial rates across neighborhoods. Users can click on each census tract to view the corresponding application and denial rates for that tract.
How the toolkit can be used
In addition to the newly added mortgage indicators, the tool integrates a broader set of fair housing metrics, including homeownership rates, housing cost burdens, job accessibility, environmental quality, and school conditions. Users can explore how these measures evolve over time for different racial and ethnic groups, compare outcomes across communities, and examine how credit access intersects with neighborhood opportunity. For example, users can see what factors are associated with a high mortgage denial rate in a specific neighborhood.
By enabling these analyses, the toolkit supports evidence-based local planning and policymaking aimed at identifying barriers, targeting interventions, and ultimately promoting homeownership opportunities that are accessible to and sustainable for everyone.
Let’s help communities build more secure, hopeful futures.
Today’s complex challenges demand smarter solutions. Urban brings decades of expertise to understanding the forces shaping people’s lives and the systems that support them. With rigorous analysis and hands-on guidance, we help leaders across the country design, test, and scale solutions that build pathways for greater opportunity.
Your support makes this possible.